Subscribe to Our Blog
Unlimited’s perspectives on what the first part of 2023 will bring for the economy, its path from the current not-too-hot, not-too-cold state, and the implications on markets. Topics covered:
- The US Economic Cycle Has Played Out Much Slower Than Most Expected
- Major US Asset Classes Are Down, But Still Pricing In Improbable Outcomes
- Positioning For The Implausible Outcomes Priced In
As we predicted last year, the US cycle has moved much more slowly than most expected. While some more cyclical sectors of the economy have softened - like construction and manufacturing - the rest of the economy continues to grow and moderating inflation has supported expanding real demand. There is little indicating an immediate recession. If anything, recent months show strengthening. Inflation also moderated as transitory inflation in supply-chain constrained sectors has shifted to disinflation. Put together, it looks like the perfect picture of goldilocks - decent growth, secularly low unemployment, moderating wage growth and low inflation.
The trouble is that this dynamic is unlikely to persist for too long. The labor market remains tight, and that means that growth and incomes are likely to continue given the current economic momentum. Most of the disinflation is coming from the goods sector and will eventually roll off bringing inflation back closer to elevated service sector inflation. And the longer that the economic strength persists, the more inflation pressures will build and the greater the pressure for the Fed to tighten further. If economic momentum continues, it will sow the seeds of the tightening needed to generate the economic slowdown needed to reverse it.
In these sorts of circumstances it's best to look at what is implied by market pricing and compare that to the plausible range of outcomes to get an edge. For instance, major stock indexes fell in ‘22 but that was mostly driven by higher discount rates - so most large cap stocks still price in low risk of earnings declines and recession. Bonds, on the other hand, are pricing in a pretty immediate recession with the Fed delivering large cuts as soon as the back half of ‘23. And inflation sensitive assets like break-even inflation and commodities are back to their pre-war lows implying a perfect return to the Fed's 2% target.
All of this asset pricing is likely to be wrong. Eventual recession is more likely than priced into the stock market, less immediate than priced into the bond market, and inflation is more likely to be stickier than what commodities and BEI is pricing. Put together, it suggests that the current 60/40 is probably the worst portfolio to own, and things like cash, commodities, gold and diversified alpha strategies are the best. Yet the vast majority of investors are vastly underweight these assets and overweight traditional 60/40.
The first few trading days of the year have provided a window to improve diversification. Now is the time to act before investors get caught offside in one direction or the other.
The US Economic Cycle Has Played Out Much Slower Than Most Expected
Many investors today have never seen a “normal” economic cycle (and those that have may not remember what one was like) and only know crisis-induced cycles. Typical macro driven cycles take a while to play out - for instance, the 2000s cycle took almost three years from peak to trough.
This cycle playing out much more like a typical macro cycle has surprised many investors and economists. While growth conditions have moderated from the boom just after COVID and some sectors have started to weaken, the economy overall kept functioning pretty well - that was a surprise. In fact, this year has had the longest streak of better than expected employment reports in decades reflecting the fact that most thought the economy would fall off a cliff, while it has in fact continued along just fine.

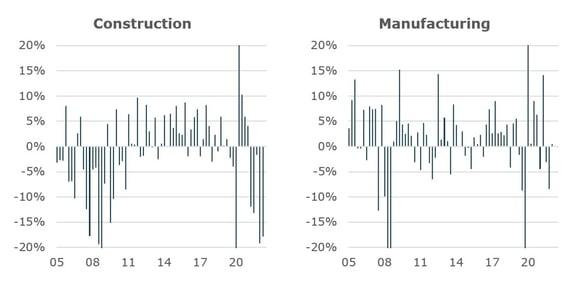
The Fed’s tightening so far has created some weakness in the sectors that are typically most sensitive to monetary policy, as expected. It’s well known that the residential real estate market has been weakening in recent months and manufacturing has been soft. While these contributed to a drag in the overall economy, there are some signs that the construction decline may be ebbing and that employment in these sectors has held up. While the construction sector is typically the most leading, it often can take an extremely long time between the peak in housing and the weakening of the broader economy.
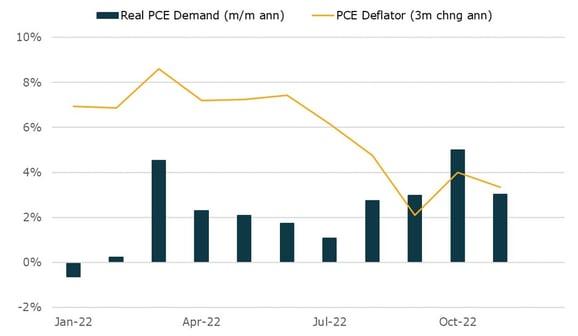
What has been much more important that has kept the economy going is the strength in consumer demand. The transition from elevated inflation earlier in 2022 to lower inflation in the back half of the year was itself a stimulative pressure, which reduced the amount of nominal spending growth needed to keep real growth strong. Most households went from having to draw down their savings to pay for fast rising prices to spending much closer in line with their higher income growth, which is much more sustainable. The most real time measures of goods spending remains pretty good and services demand continues to boom.
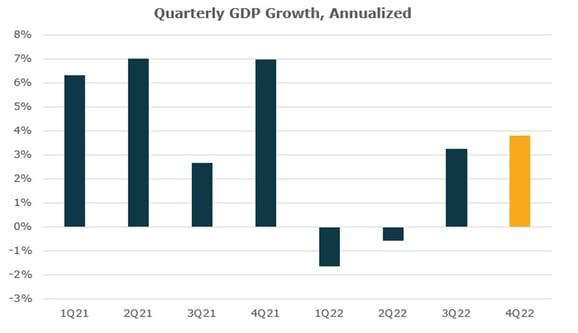
Netting across the different pressures on the economy in the last few months shows that growth at least through the end of the fourth quarter remains pretty strong. The chart below shows the quarterly growth rate annualized with the most recent figure reflecting the Atlanta Fed GDP Now estimate for the fourth quarter. That estimate uses available information in the fourth quarter and weighs the stats based on their GDP outcome. The 3.8% reading for 4Q22 is driven significantly by continued strength in PCE, strength in business investment, and a moderation of the drag from residential investment. A much better outcome than the vast majority of prognosticators suggested given the magnitude of QE and tightening.
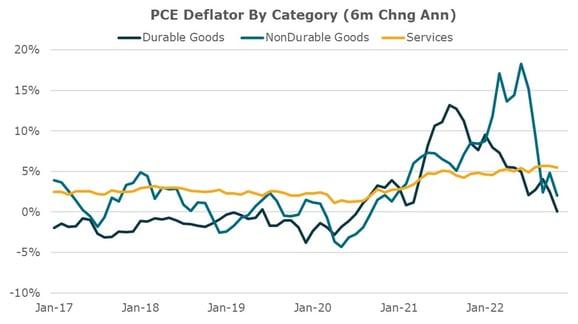
At the same time that growth has actually improved overall, inflation has come down. Most of the decline was driven by the resolution of the supply-chain pressures that faced the economy due to COVID (durable goods) and the inflationary pressures in food and gas that came after the start of the Ukraine war (non-durable goods). Both of these categories have shown significant signs of falling price growth in the second half of 2022, leading to much more moderate total inflation. In contrast, services inflation, which covers a much bigger portion of the US economy, has remained quite elevated and is still rising now above 5%.
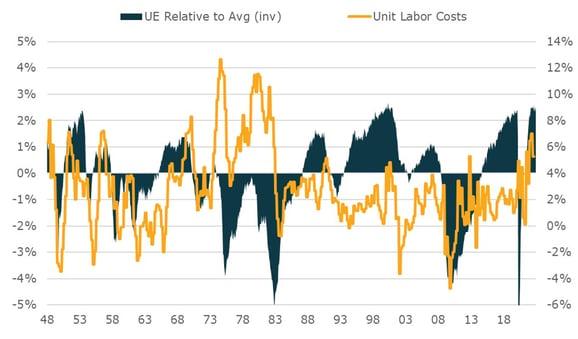
How both growth and inflation will play out will be a function of the labor market, and particularly how wages evolve over the course of the next 6-12 months. In credit-driven cycles employment and incomes typically lag the cycle because credit declines drive spending declines which eventually drive a weakening of the labor market. In income-driven cycles the story is very different. How incomes evolve leads to whether or not spending continues.
The labor market and income growth looks about as strong as it has been in some time. Unemployment is at secular lows, timely measures of the labor market look strong, and a broad look at wages suggests continued relatively strong income growth even if off a tad from peak. That suggests there is a great deal of momentum going in the economy as it enters 2023. As the chart below shows, labor markets this tight typically continue to create upward pressure on wages. Put together, it looks like both inflation and growth will continue to experience upside pressure in the first half.
Tactically the Fed is getting exactly what it wants - lower inflation and a continued strength in the economy. Despite significant tightening the Fed has not durably brought inflation down or increased slack in the labor market in order to keep pressure down on wages. A big reason may be that the private sector sensitivity to rising interest rates has declined a lot over the last decade.
So while the Fed is getting a great outcome for now, once the disinflationary dynamics from goods wash through, income growth is likely to drive continued elevated spending growth, driving inflation that is higher than desired. Said differently - the goldilocks period is most likely transitory because the strength it creates sows the seeds of the need for tighter policy.
Major US Asset Classes Are Down, But Still Pricing In Improbable Outcomes
Any way you slice it, 2022 was one of the worst years for financial assets in all of history. The only other years where a diversified financial asset portfolio did this poorly was the Volcker tightening, the depression, and the premature ‘37 tightening.
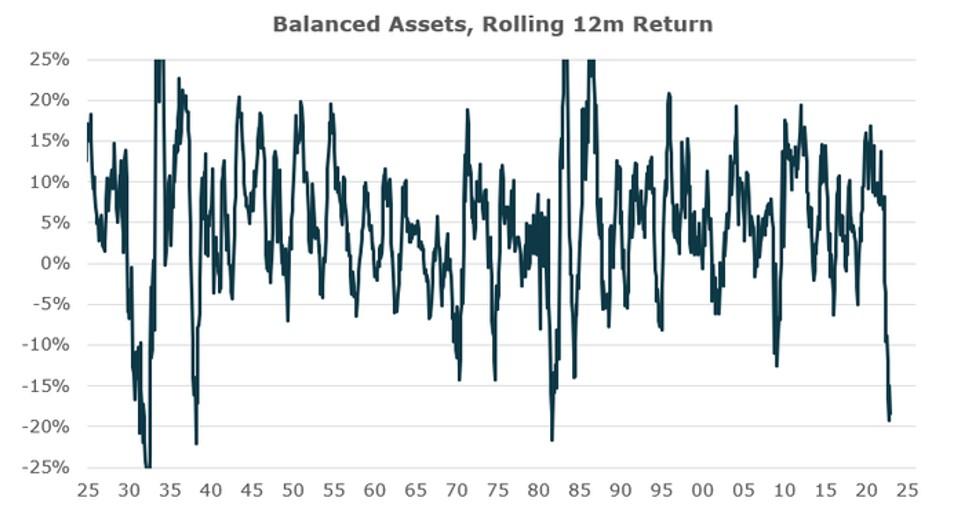
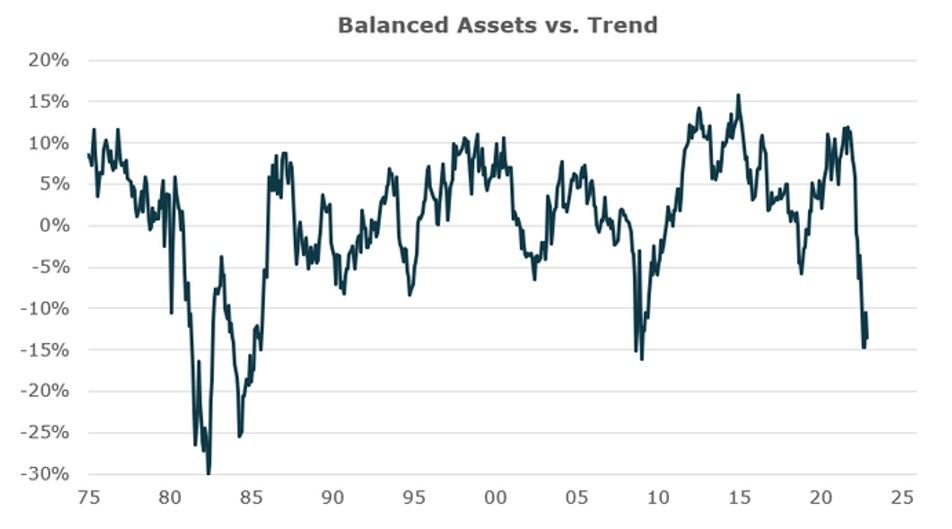
At this point, aggregate asset prices are well below trend on par with asset levels following the financial crisis. But scanning across the major asset classes suggests the current pricing suggests an implausible and inconsistent combination of outcomes across markets.
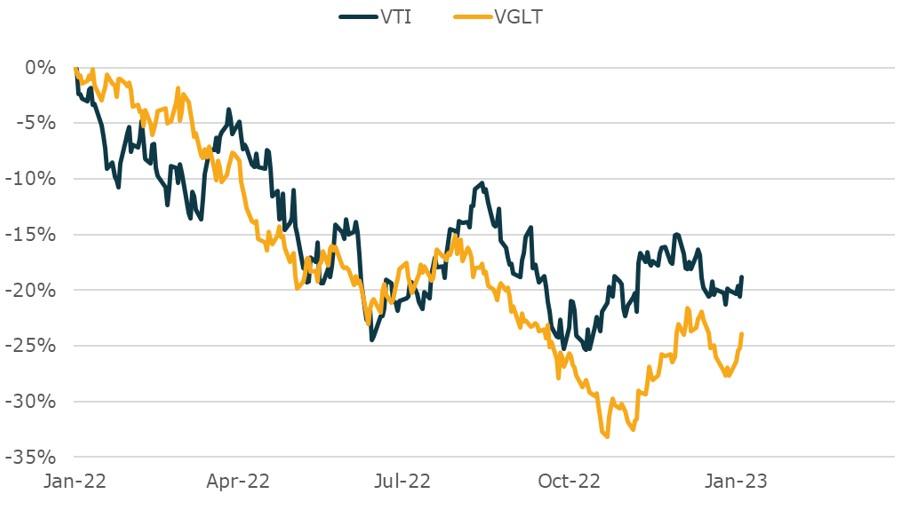
Stocks are showing some of the most unlikely pricing of any asset class. While stocks fell in 2022, the declines were primarily driven by the rise in discount rates. The result is that top-line earnings expectations priced into stocks have not moved hardly at all from the peak in early 2022. While stocks have declined, they actually look more expensive today than they did at the peak in pricing roughly a year ago.
While inflation benefits earnings because they are nominal, it looks to be a pretty low probability outcome that there will be no growth weakness and with it no decline in earnings. If strong economic conditions persist and inflation pressures remain elevated, the Fed will likely need to add even more tightening and drive an even harder eventual landing than previously thought. That would be quite bad for stocks. On the other hand, if the economic deterioration comes more quickly than expected that too would be a difficult outcome for stocks.
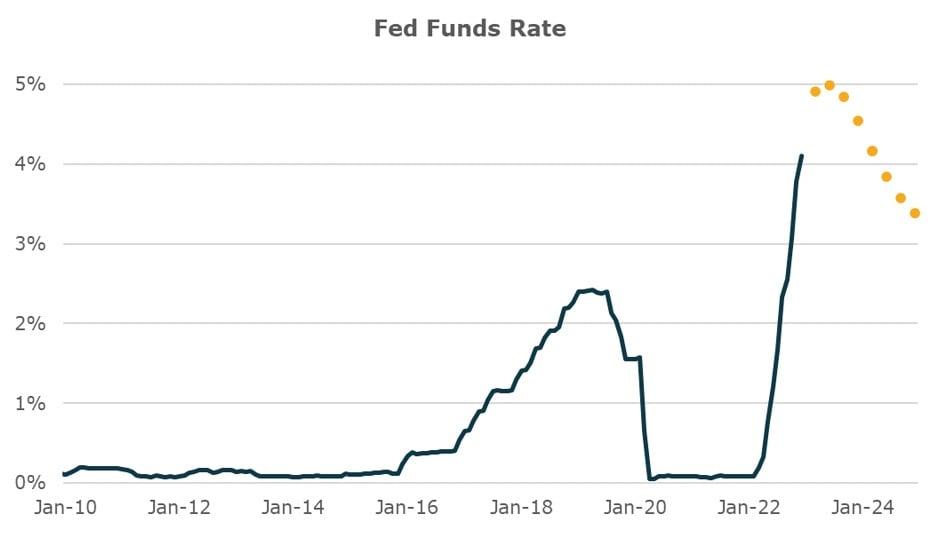
The interest rate market is pricing in a very different outcome. Current short rate pricing suggests that the Fed will raise another 50-75bps in the first half of the year and then begin a relatively aggressive easing cycle in 2H23 and 2024, cutting 200bps from peak levels. While there will probably have to be a recession at some point in order to get the type of weakening of the labor market necessary to ease inflation pressures and that will eventually cause the Fed to ease, what is currently priced in looks like a very fast shift to easing during an inflationary cycle. Most likely investors are benchmarking off a Fed over the last three decades that has been responsive primarily to growth rather than inflation concerns.
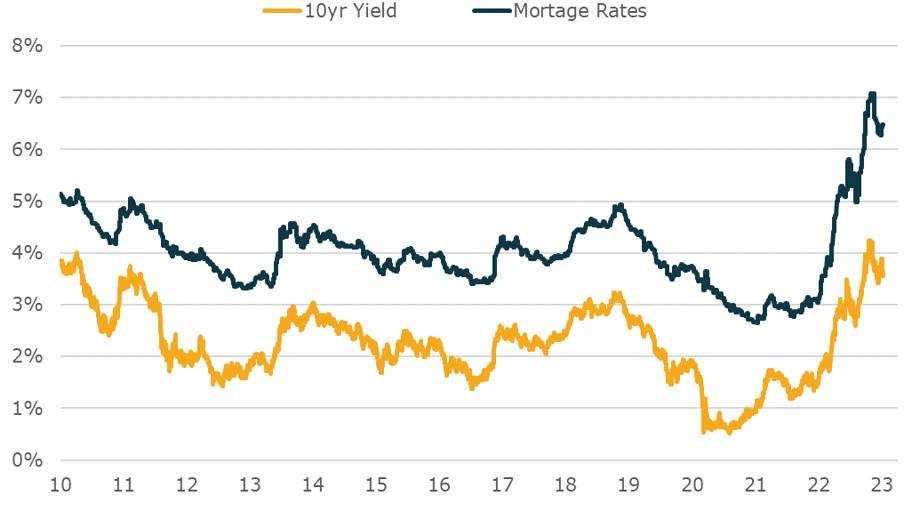
Rallies in longer-term bonds on expectations of recession are also self-defeating. Many folks on the street have conveyed how bonds are a good deal because there is likely to be a recession at some point in 2023. The trouble with that logic is that the act of buying bonds depresses yields which makes a recession less likely to occur as borrowing rates become more stimulative. For instance, as bonds rallied in December, yields on new mortgages came in 100-150bps depending on the specific structure. Many cited that move as creating a bit of stability for the housing market, which only extends the cycle. Instead, investors are much better off buying bonds only once the Fed begins to ease, not well ahead of the recession.
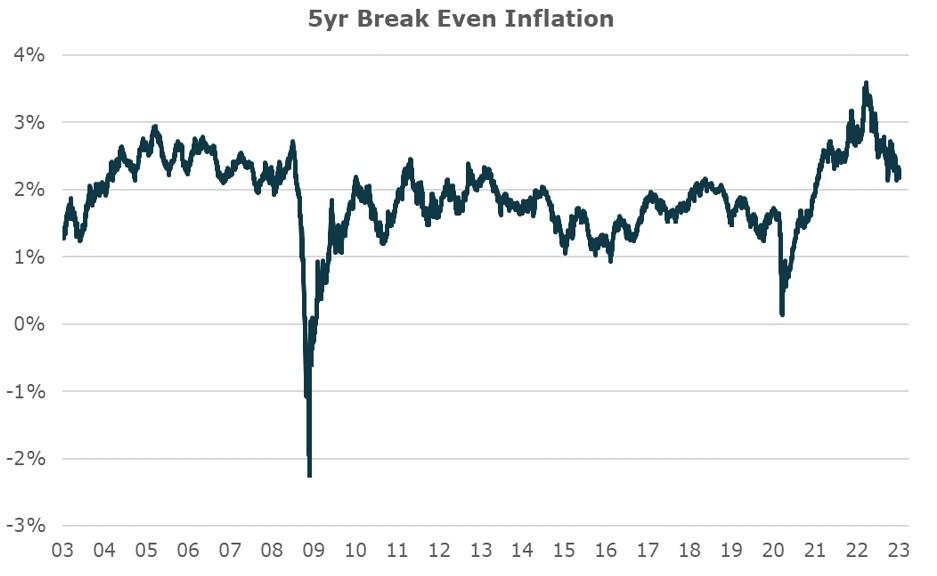
Asset markets are also pricing in a return to normalcy when it comes to inflation. Breakeven inflation has come down substantially from earlier in the year. At this point, 5 year breakevens are now right at 2%, reflecting an expectation that inflation will come down quickly and durably to the Fed’s target. While that is possible, it is extremely unlikely that it will occur without a more substantial deterioration in the labor market. Said differently, the probability of both low bond yields and high stock prices together is very low - and that is essentially what the 60/40 portfolio is betting on.
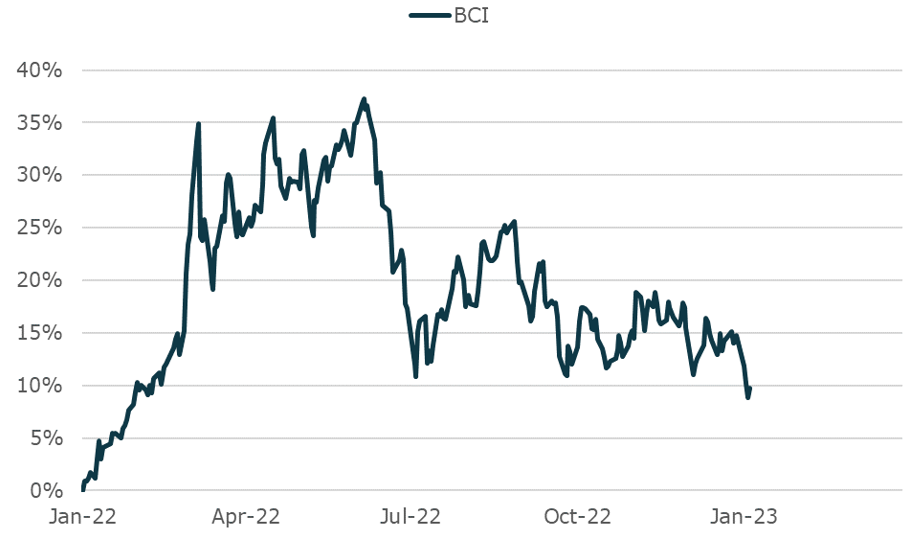
Commodity markets also indicate a return to relatively low inflation. The vast majority of the commodity price rise at the start of 2022 has been reversed at this point. BCI, the diversified commodity ETF, is now less than 10% above where it was at the start of 2022. Further, prices for oil, copper, and other commodities remain relatively low compared with periods of elevated demand, particularly when Chinese growth is at least moderately strong. What is most unlikely is that stocks can stay as strong as they are above, and commodities stay as low as they are now. That makes holding a long commodity position an attractive diversifier relative to stocks.
Positioning For The Implausible Outcomes Priced In
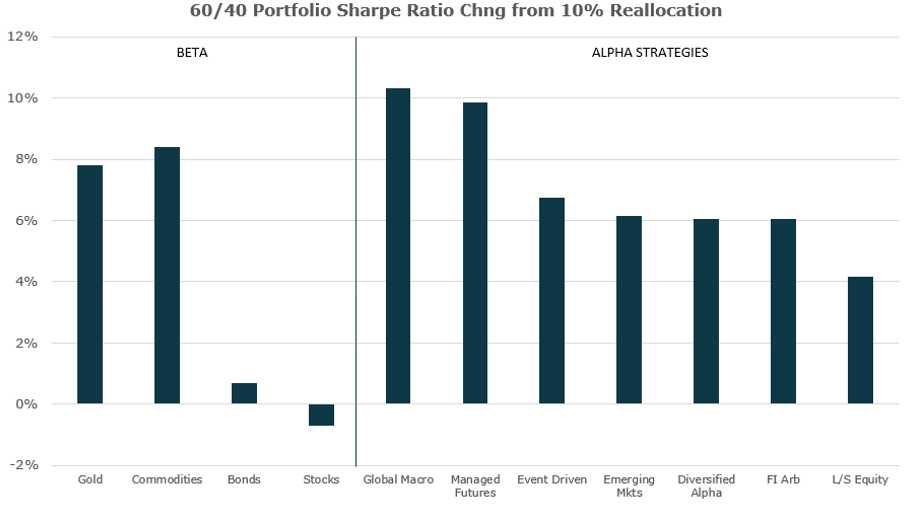
For most investors still holding 60/40 or similar positions, the combination of transitory goldilocks and what is priced into markets creates a lot of risks. Most investors would benefit from reducing their weight to stocks and bonds, which will suffer if monetary policy tightens further, and increasing their positions in cash and commodities, which protect portfolios from rising inflation pressures. Investors may also benefit from investing in alpha strategies that have the ability to tactically navigate these environments in a way that is more agile since market conditions will likely change.
The interesting thing about this tactical dynamic set of conditions is that it also aligns with how investors should more strategically position their portfolios to increase diversification as well. As we highlighted in our recent post A Prime Opportunity To Improve Diversification, allocations to these assets provide the most valuable diversification opportunity for a 60/40 portfolio structurally.
This extended inflationary cycle is very different from any of the cycles that investors today have experienced in their lifetimes. It is also very different than any cycle we have experienced in decades. The result is that there is still a great deal of uncertainty about how it may play out. For years, holding cash was not a useful alternative asset because it was so poorly yielding. In this cycle, it is worth recognizing that cash may also be one of the better assets to hold. It allows investors to reduce their risk while enjoying modest return.
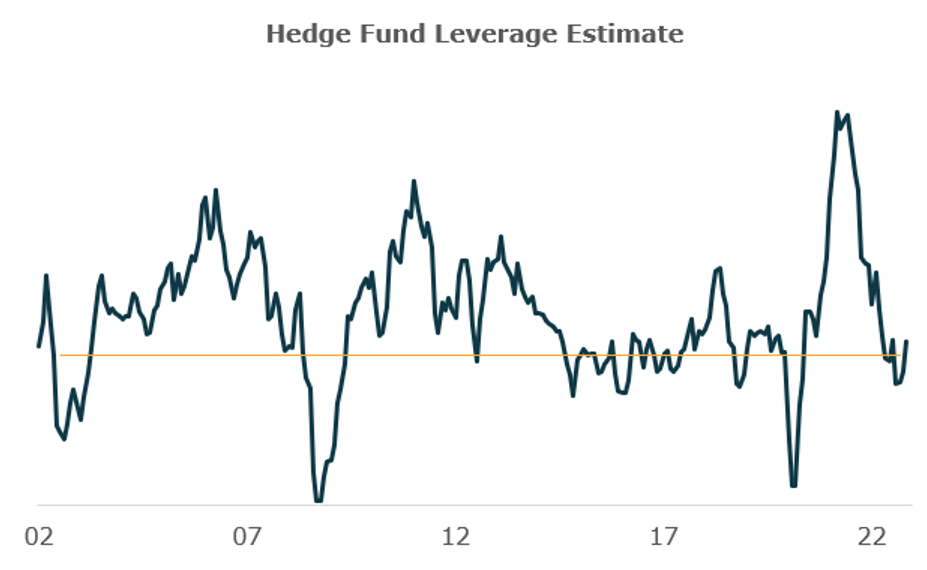
As we highlighted in our recent piece Hedge Funds Cautiously Looking For Opportunities Entering 2023, when we look at this group of sophisticated investors with some of the widest mandates and most tactical flexibility, they are running relatively low risk, which reflects the uncertainty of this cycle. That may be the best lesson for any investor right now. While the path described above and the implications on markets are our best view of what the first part of 2023 will bring, our uncertainty is much higher than normal. So it is probably best to reflect that. Now is the time for diversification and low risk until the timing of the cycle’s turn becomes clearer.