
What's Under the Hood? What Matters For ETF Liquidity
Subscribe to Our Blog
Understanding the liquidity of an individual stock, bond, or futures contract is straightforward. But what is the right way to think about the liquidity of an ETF? ETF products trade a certain number of shares each day, but ETFs are bundles of other securities themselves. As a result, the liquidity of the underlying holdings winds up being just as important for investors as the liquidity of the ETF itself. An easy way to measure the cost of liquidity is with a security’s bid-ask spread, or the difference between the price offered by sellers and the price demanded by buyers. This spread acts as a form of transaction cost, and illiquid securities tend to have wide bid-ask spreads. With ETFs, the bid-ask spread represents an upper bound or theoretical transaction cost. In practice, orders can be structured to minimize these costs.
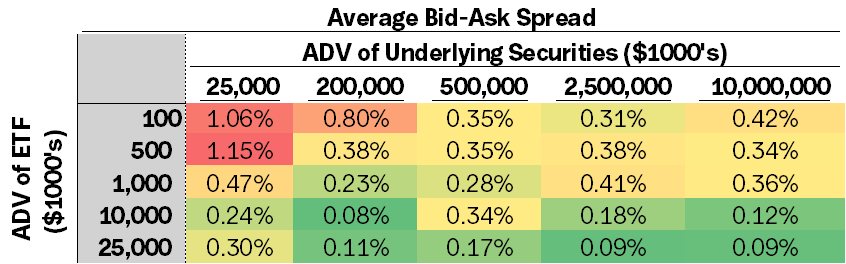
The table below shows the average bid-ask spread for 290 equity sector and thematic ETFs sub-sampled1 by both the position-weighted liquidity of their underlying assets and the liquidity of the ETF itself. In the top-left corner of the table, the data show ETFs that have low traded volume and hold relatively illiquid securities. Here, the bid-ask spreads are wide, averaging a full 1%.
Conversely, in the bottom-right corner of the table, we see ETFs that have both high traded volume and hold highly liquid underlying securities. In these cases, spreads are very tight, less than 1/10th of 1%. What’s most interesting is that ETFs that have low daily volume, but hold highly liquid underlying securities wind up having a similar liquidity profile to high-volume ETFs that hold relatively illiquid securities. The data show that to avoid the costs of illiquidity, investors must pay attention not only to the liquidity of the ETF, but also to the liquidity of the ETF’s underlying holdings.
**Source: S&P CapitalIQ
Liquidity of any instrument is dependent upon market conditions. No Representation is being made that liquidity of any Unlimited investment vehicle will be available in any market environment.
Unlike other investment vehicles, ETFs are uniquely maintained through a process called ‘create-redeem’. Creation is the process where bundles of underlying securities are acquired and converted into the ETF structure. When assets flow into an ETF, securities are purchased and wrapped. Redemption unwinds this process; when an ETF sees outflows, securities are unwrapped and sold as individual securities. The process of creation and redemption is managed by two parties: an ETF sponsor and authorized participants (APs). APs are responsible for creating and destroying ETF shares through creation units, which hold a weighted bundle of underlying securities of the ETF. The AP purchases the underlying bundle of securities, delivers them to the ETF sponsor, and receives shares in the ETF in return. The ETF shares are subsequently traded in the secondary market on an exchange.
This back and forth between the ETF sponsor and the AP balances supply and demand for the ETF product with transactions in the underlying securities. When demand increases, the AP bundles more securities and the sponsor creates more shares in the ETF. The redemption process works the same way, but in reverse. APs will buy shares of the ETF and exchange the ETF shares for the creation units, which contain the underlying securities. It is through this create-redeem process that the liquidity of the ETF becomes a partial function of the liquidity of its underlying assets.
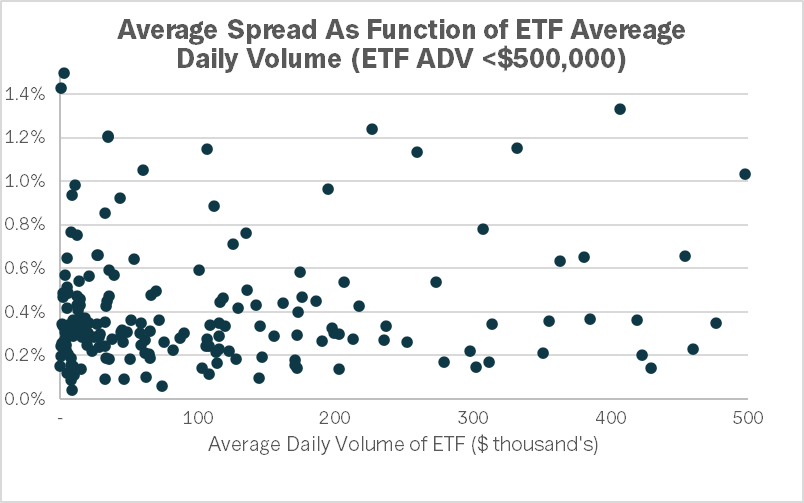
Because of the create-redeem process, the effective liquidity of the underlying can be many multiples of the liquidity of the ETF itself. This is generally true for ETFs, but the importance of the effect is magnified among smaller ETFs. The figure below shows how bid-ask spreads of ETFs with less than $500k in average daily volume (ADV) vary with changes in the volume of the ETF itself. There does not appear to be much of a relationship: below our $500,000 threshold in daily volume, increases in ETF ADV don’t reliably dampen bid-ask spreads.
**Source: S&P CapitalIQ
Liquidity of any instrument is dependent upon market conditions. No Representation is being made that liquidity of any Unlimited investment vehicle will be available in any market environment.
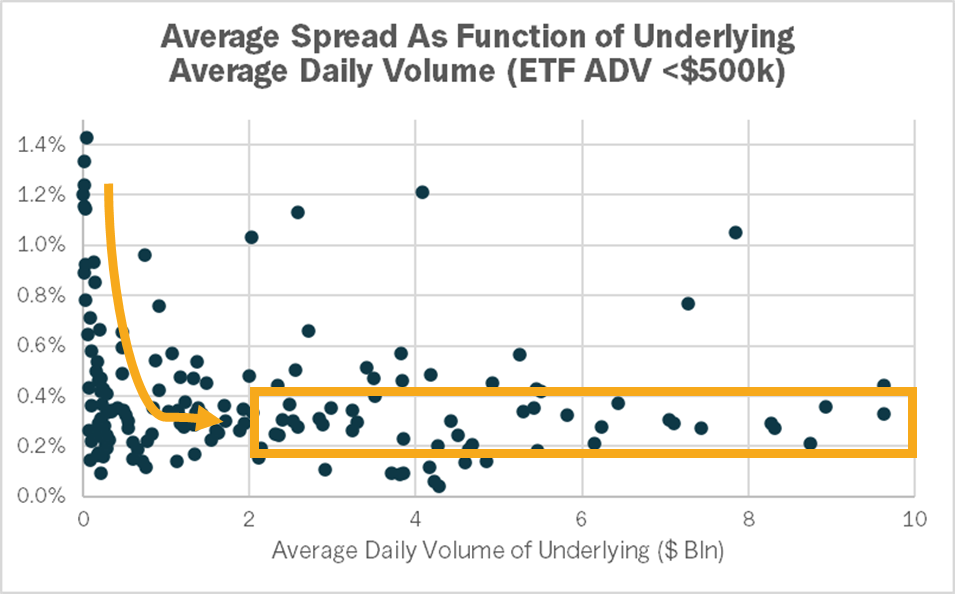
However, if we plot the bid-ask spreads of the exact same group of ETFs, but this time against the average daily volume of the ETFs underlying securities, we see a much clearer relationship. The data show that spreads decrease non-linearly with increases in volume in the underlying. The data show average bid-ask spreads drop quickly as the average daily volume of the underlying increases. Once average daily volume of the underlying securities reaches $2B, bid-ask spreads stabilize between 0.2-0.4%. For reference, the Russell 1000 ETF (IWB), which averages $175M in daily volume, trades with a bid-ask spread of 0.04% and the position-weighted volume of its underlying holdings is $3.6 billion.
**Source: S&P CapitalIQ
Liquidity of any instrument is dependent upon market conditions. No Representation is being made that liquidity of any Unlimited investment vehicle will be available in any market environment.
While most investors have learned that liquidity is best connected to volume of transactions, these observations highlight that, for the ETF space, the volume of the underlying securities are an equally important factor in determining trade costs. For those hesitant to invest in a newer or smaller fund because of low trading volume, it is important to consider the underlying to really understand the costs that may come with buying or selling shares
1 https://www.justetf.com/en/etf-lists.html
For informational and educational purposes only and should not be construed as investment advice. Nothing herein constitutes an offer to sell or a solicitation of an offer to buy any security. No investment strategy or risk management technique can guarantee return or eliminate risk in any market environment. While all information prepared in this depiction is believed to be accurate, Unlimited makes no express warranty as to the completeness or accuracy, nor can it accept responsibility for errors appearing in this document.
