Not All-in on US Mega Cap Stocks? That's Prudent, But Currently Underperforming
Subscribe to Our Blog
Published by Bob Elliott on Dec 4
An Update on the Lagging Performance of the Simple Gameplan Portfolio
US stocks outperformance of pretty much everything returned again in 2023, making any prudent diversified portfolio look like an underperformer in comparison. Other than the hiccup in 2022, a concentrated stock portfolio has been the best portfolio to hold since the GFC, and the more mega cap companies the better. For those with a short time horizon, that seems to be all that matters - stocks have been the clear winners for years now. But a concentrated position in US stocks is unlikely to outperform forever and over time a more diversified portfolio across asset classes and investment strategies should deliver more consistent returns than one concentrated in the single asset class of a single geography.
Earlier this year we wrote about a Simple Gameplan investment portfolio that brought together the concepts of a diversified portfolio, increased inflation protection, and agility to navigate challenging market conditions. The portfolio is 60% balanced beta tilted to commodities, 20% trend strategies and 20% diversified alpha. Over the last 50 years this mix has shown to deliver returns on par with 60/40, but with almost half the volatility and drawdowns in real terms. But it isn’t always better.
In 2023 the Simple Gameplan portfolio underperformed, generating returns of 1% relative to 60/40 at 12% and cash at nearly 5% YTD. Taking a slightly longer view of the extremely volatile last 4 years shows that the approach has beaten cash modestly but has trailed the outcome from 60/40 by a little more than 2% per year on average (though with about 1/3 less volatility).
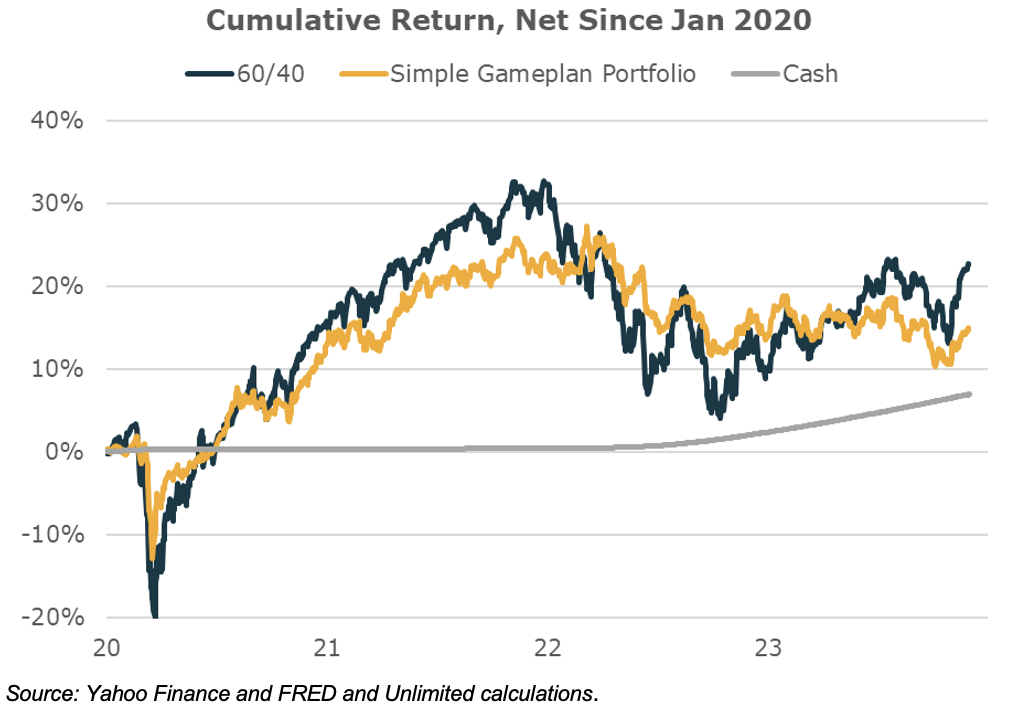
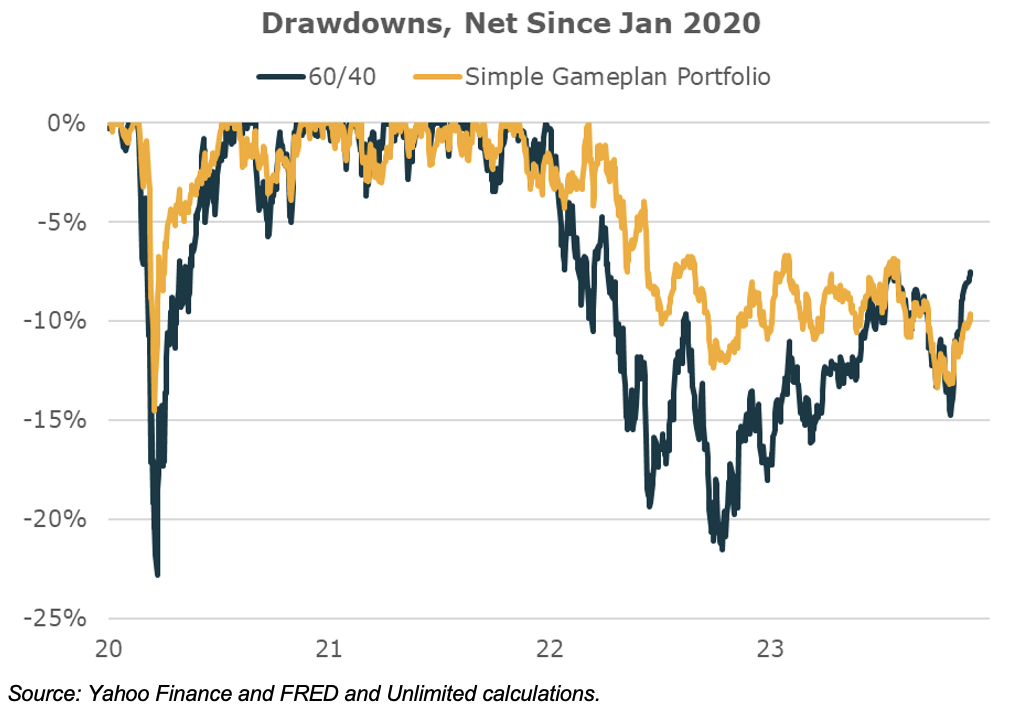
The increased diversification of the portfolio has led to weaker returns, but has also limited comparative drawdowns during the acute phase of 2020 and through the first three quarters of 2023.
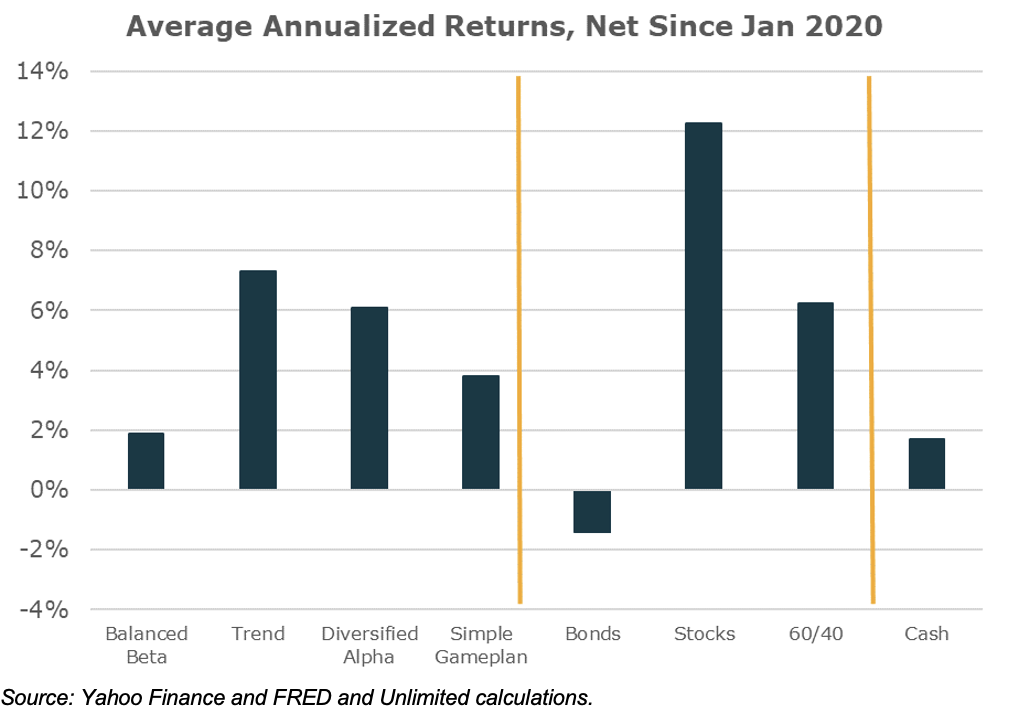
Since the start of 2020, the primary driver of the relative outperformance of the 60/40 strategy to the Simple Gameplan portfolio has been significantly stronger stock performance than normal, combined with balanced beta, trend following, and diversified alpha all performing worse than they have historically.The chart below gives some perspective on the asset returns annualized over the last 4 years. Stocks have notably outperformed the returns of each of the Simple Gameplan’s underlying strategies, and in particular outperformed a balanced beta portfolio (primarily because it holds more bonds and commodities).
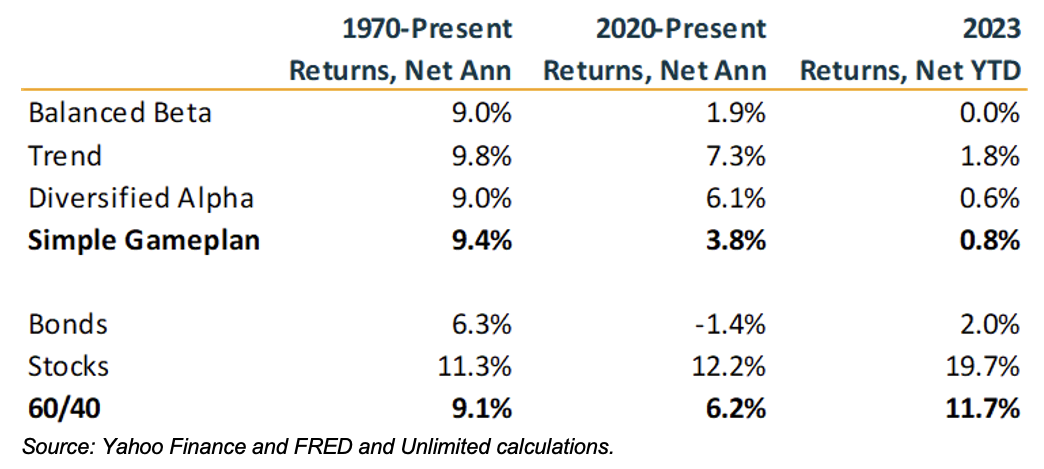
This 4-year period has been unusual, with each of the Simple Gameplan’s underlying strategies meaningfully underperforming their long-run averages, while US stocks in particular have greatly outperformed their long-term average performance. Believing that the 60/40 will continue to outperform requires the view that stocks in particular will continue to meaningfully outperform their long-term averages and all other financial assets. Of course, it’s possible, but it is a heck of a bet.
The cumulative outperformance of US stocks relative to all other assets in the world is approaching extremes of the last 100 years. The only times similar extremes were reached was at the height of the 2000 equity bubble and the 1929 bubble peak. While stocks are just off all-time highs, other assets are basically at all-time lows relative to their expected trend performance. As a result, not only are US stocks elevated, but they are particularly elevated relative to other financial assets as well as all other countries’ equity indexes. What is priced in now is extraordinary US mega cap supremacy.
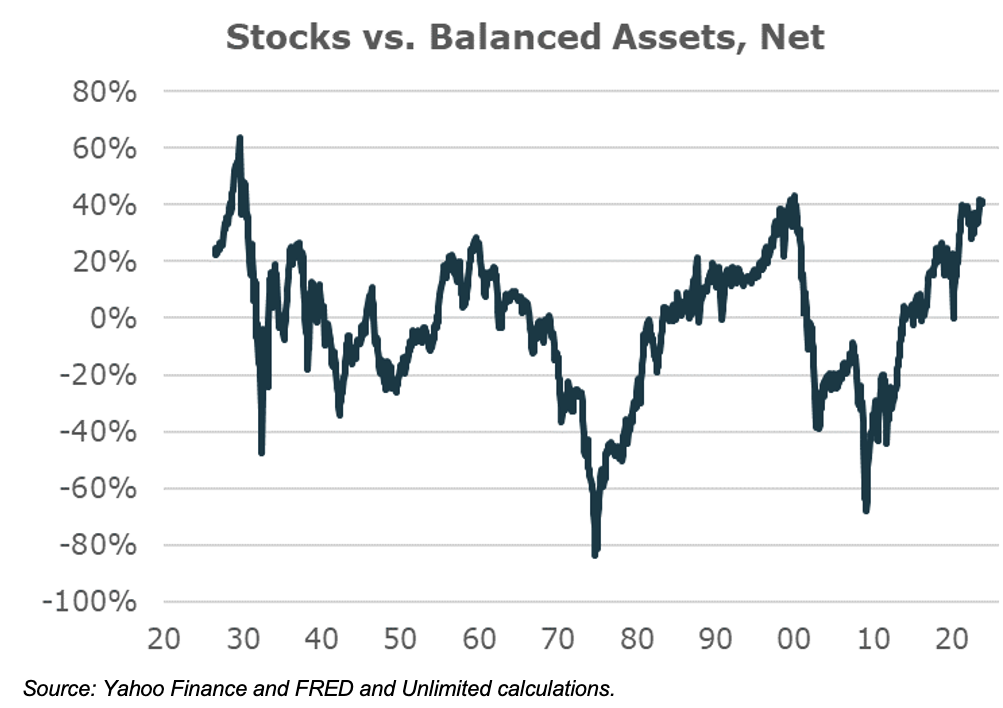
At this point that outperformance had led to century level extremes. While of course it could push further, indications are for those folks with a longer time horizon more diversified portfolios like the Simple Gameplan are better positioned to deliver more consistent returns ahead.
For informational and educational purposes only and should not be construed as investment advice. It does not constitute an offer to sell or a solicitation of an offer to buy any security. Opinions expressed are our present opinions only. No Representation is being made that any investment will or is likely to achieve profits or losses similar to those shown herein. This material is based upon information which we consider reliable, but we do not represent that such information is accurate or complete, and it should not be relied upon as such. The historical analysis should not be construed as an indicator of the future performance of any investment vehicle that Unlimited manages. Simulated, backtested, modeled, or hypothetical performance results have certain inherent limitations and are for illustrative purposes only. Such results are hypothetical and do not represent actual trading, and thus may not reflect material economic and market factors, such as liquidity constraints, that may have had an impact on actual decision-making. Such results are also achieved through retroactive application of a model designed with the benefit of hindsight and cannot account for all financial risk that may affect actual performance. No representation is being made that any investor will or is likely to achieve results similar to those shown. No investment strategy or risk management technique can guarantee return or eliminate risk in any market environment. Net returns were calculated utilizing reasonably indicative fees to create a conservative comparison: Diversified alpha @ 100bps, Beta @ ETF level fees.

