
Subscribe to Our Blog
One of the hardest things to do in investment management is figure out if outcomes are a function of luck or skill. Often differentiated performance is simply luck - for instance when a particular economic environment either favors or drags on a manager’s performance for an extended period of time. The last 5 years have provided pretty unique data to get perspective on the odds that managers’ performance are driven by luck versus skill. In the matter of a few short years there have been economic expansions and contractions, easings and tightenings, and rising and falling inflation. The result is that the last 5 years offers a distribution of manager returns that represents a broad set of conditions, likely showcasing the real distribution of performance outcomes.
This more representative distribution of returns indicates that the odds of a single individual manager’s outperformance relative to the industry is no better than random chance. Allocators with confidence they can identify the “best” funds are most likely being fooled by randomness because manager outperformance is most likely a function of luck of that randomness and not skill. This stress test reinforces the perspective that allocators are better off focusing on manager diversification, balancing their alpha to different economic conditions, and fee reduction than trying to pick winners.
The Distribution of Manager Returns Is No Better Than Random Chance
To explore this in more detail we take a look at the distribution of returns from roughly 2000 managers* over the last 5 years and compared that distribution of returns to the results of a simple simulation of the range of expected outcomes over the last 5 years given the returns profile of the average fund (6% net return and 16% annualized volatility)**. Fund return outcomes basically align with the random chance distribution. If anything, the right tail is underrepresented with funds generating >15% returns representing just 5% of the sample vs. an expected 8% based on random chance.
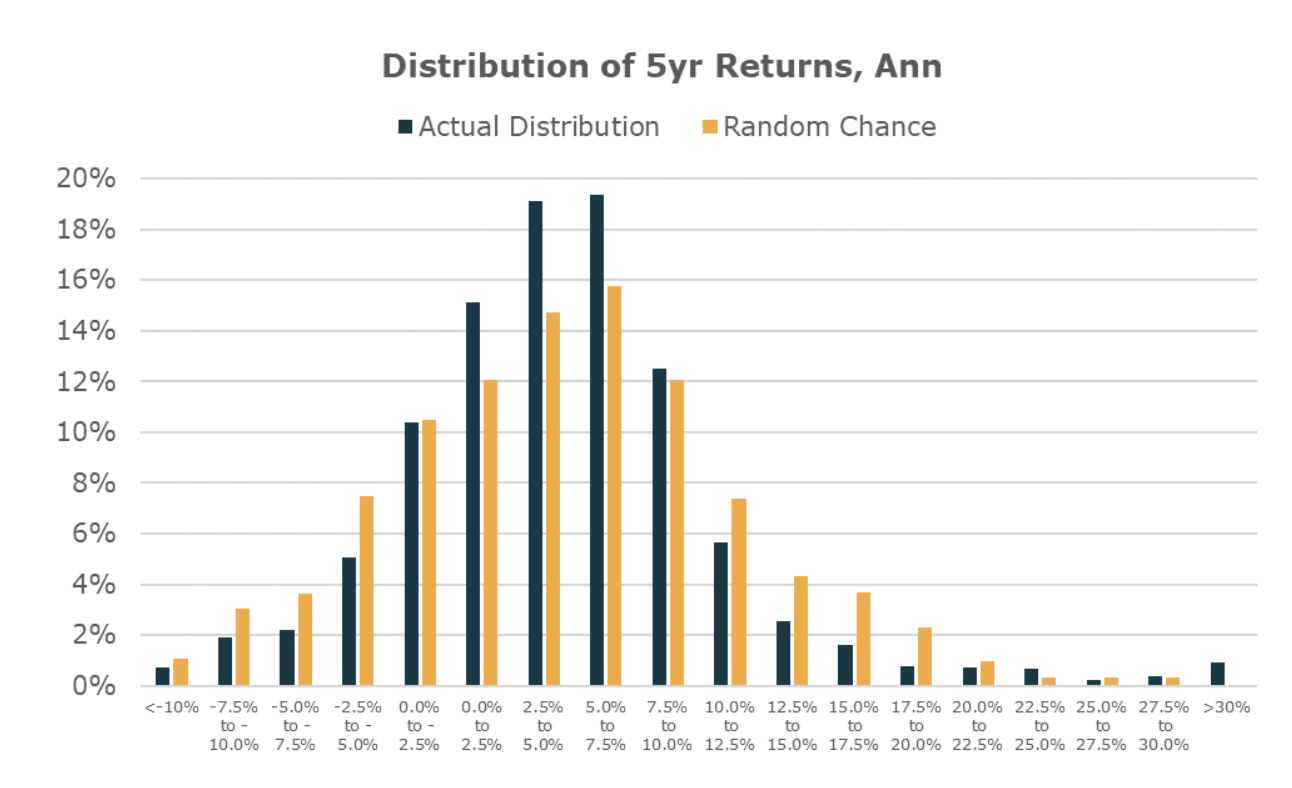
The results depicted are aggregated results and do not represent returns that an investor attained. Past performance not indicative of future results. For informational and educational purposes only and should not be construed as investment advice. Source: Preqin, Credit Suisse, Barclaryhedge, Bloomberg, and Unlimited Calculations
It is also useful to look at the distribution of Sharpe ratios since many the tails of returns often involve taking on more volatility to generate higher returns. Similar to the return distribution, the distribution driven entirely by random chance (using the average fund’s return and risk) is also pretty close to the Sharpe ratio outcome seen in the actual distribution. Here the right tail of realized Sharpe ratios are slightly better than random chance, with greater than 1.50 Sharpe occurring about 2% of the time relative to 1% in a random chance scenario (totaling about 20 more funds than you would expect out of 2000).
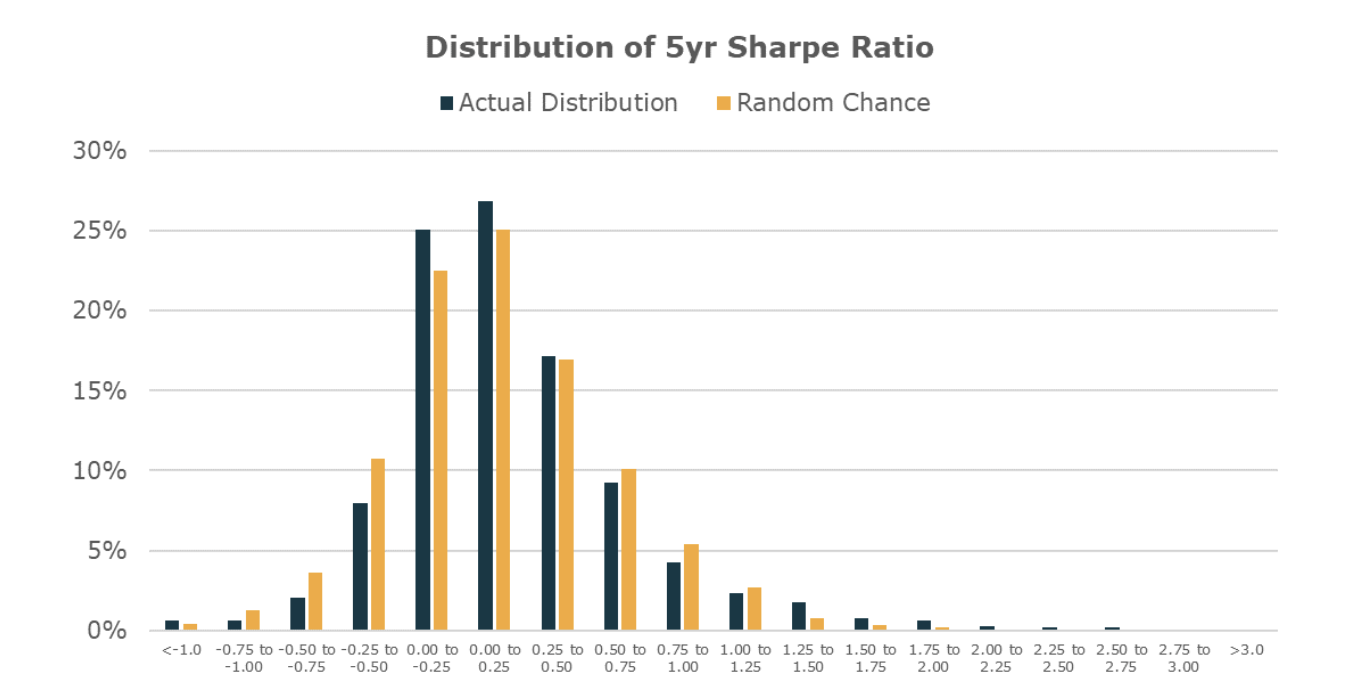
The results depicted are aggregated results and do not represent returns that an investor attained. Past performance not indicative of future results. For informational and educational purposes only and should not be construed as investment advice. Source: Preqin and Unlimited Calculations
Finally we look at the reported Sortino ratios over the same time frame which also largely align with what would be expected given the distribution of outcomes driven by random chance. The right tail is fatter here, but the picture is largely the same with funds with >1.50 Sortino ratios representing about 8% of the distribution which is in line with what would be expected given the random chance distribution.
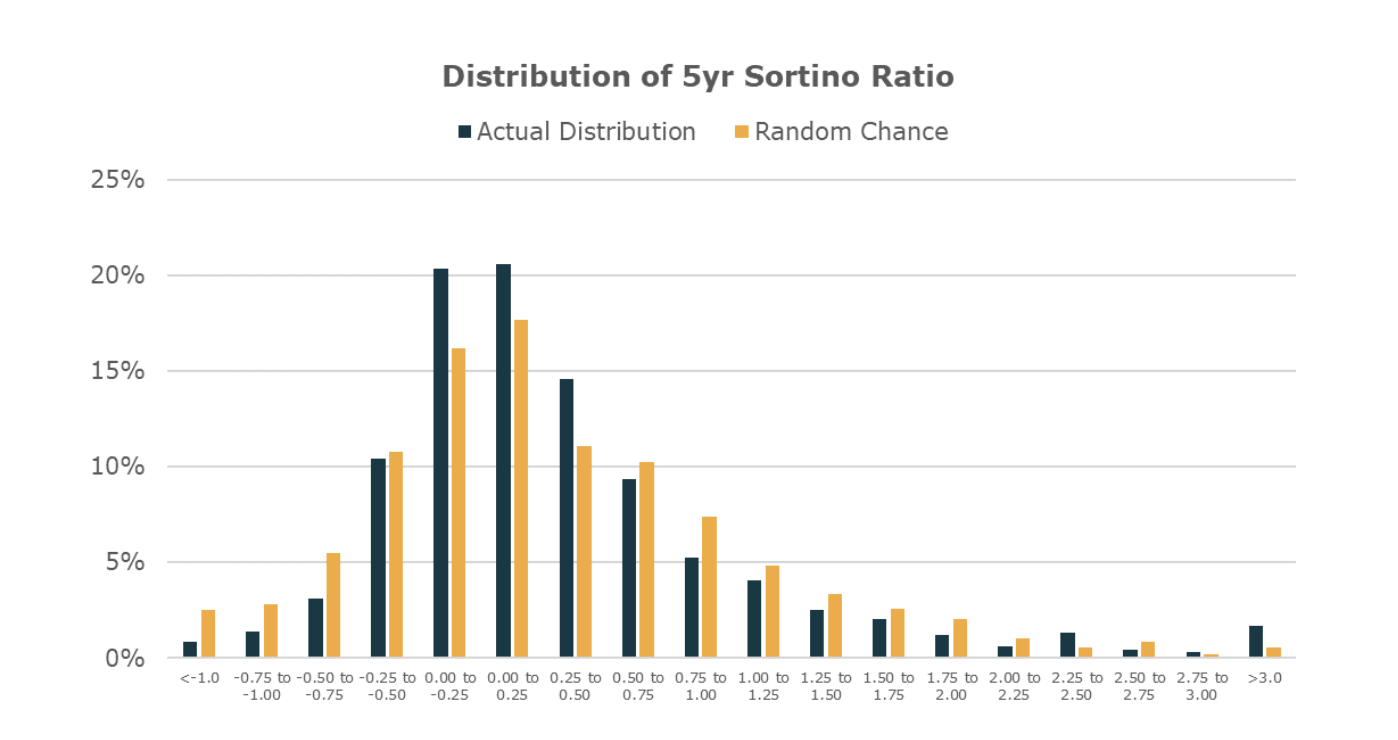
The results depicted are aggregated results and do not represent returns that an investor attained. Past performance not indicative of future results. For informational and educational purposes only and should not be construed as investment advice. Source: Preqin and Unlimited Calculations
This suggestion that the distribution of individual managers outcomes are a function of random chance rather than skill dispersion is consistent with previous research done at Unlimited that suggested managers don’t exhibit persistent outperformance at a rate much better than random chance over the last 20 years. The chart below compares the frequency of consecutive manager performance above the median manager relative to what would be expected due to random chance. The two distributions aren’t meaningfully different.
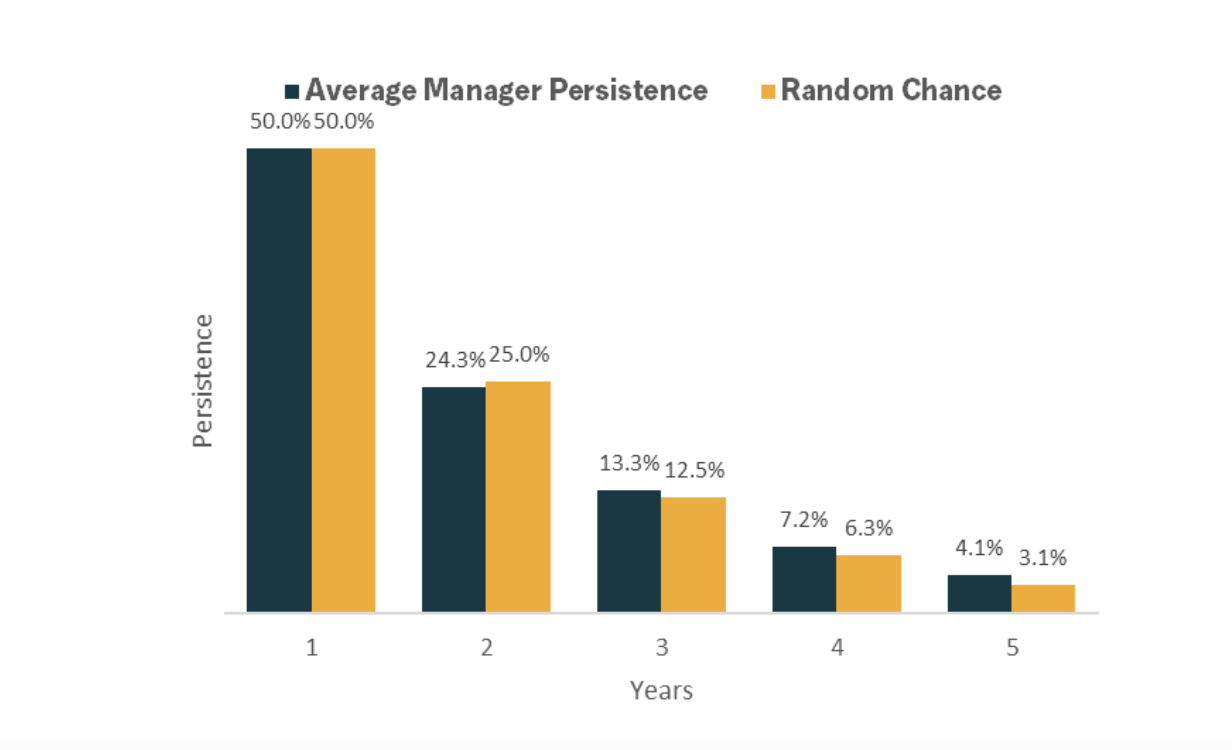
The results depicted are aggregated results and do not represent returns that an investor attained. Past performance not indicative of future results. For informational and educational purposes only and should not be construed as investment advice. Source: Preqin and Unlimited Calculations
Without The Ability to Find the “Best” Managers, The Better Approach Is To Diversify & Lower Fees
Every day we speak with allocators that insist that they only find the “best” managers. Assuming the “best” managers can be reliably found requires believing:
(a) there is a fundamental reason why some hedge fund managers will do better than others consistently over time, and
(b) a process can have consistent edge in identifying better managers
The research above highlights there is very little evidence (a) is true because manager outperformance occurs at a rate no better or more consistently than what random chance would indicate. Odds are more likely that any manager’s outperformance is more a function of good luck than of high skill. And if that’s true, then it is difficult to support that (b) makes a meaningful difference. No matter what the selection approach, finding the best managers is a fool’s errand. The lucky ones can only be known ex-post, and any allocator might have gotten lucky picking them or not picking them in their portfolio.
If manager picking skill doesn’t exist all hope for building a better portfolio is not lost. While selection alpha is uncertain, the benefits of diversification and lower fees are far more certain. Allocators can improve their portfolios not by trying to pick the individual managers, but by creating diversified portfolios of managers to help improve return consistency. Further a focus on reducing fees can generate “alpha” that is durable.
For too long allocators have spent time trying to find the next great manager that will outperform rather than building portfolios that generate consistent returns at a low cost. The last 5 years provided a truly unique stress test which reinforced this reality.
Notes
*The population sampling is based on 1405 managers reporting full 5yr returns to Preqin through Sept 2023 combined with the distribution of an estimated 615 closed funds based on a 7% annual close-rate. The combined return of the distribution was reconciled to ensure it matched the average index return from Bloomberg, Barclayhedge and Credit Suisse HF indexes over the same period.
**Random chance distribution based on the outcomes of a Monte Carlo simulation of 2000 managers seeded with return consistent with the index returns and the average reported fund standard deviation.
For informational and educational purposes only and should not be construed as investment advice. Simulated, backtested, modeled, or hypothetical performance results have certain inherent limitations and are for illustrative purposes only. Such results are hypothetical and do not represent actual trading, and thus may not reflect material economic and market factors, such as liquidity constraints, that may have had an impact on actual decision-making. Such results are also achieved through retroactive application of a model designed with the benefit of hindsight and cannot account for all financial risk that may affect actual performance. No representation is being made that any investor will or is likely to achieve results similar to those shownThe historical analysis should not be construed as an indicator of future performance. No investment strategy or risk management technique can guarantee return or eliminate risk in any market environment. No Representation is being made that any investment will or is likely to achieve profits or losses similar to those shown herein.
