
Who Is Better: Hedge Fund Allocators or Dart-Throwing Monkeys?
Subscribe to Our Blog
Every hedge fund allocator dreams of finding the portfolio of managers that reliably outperforms the benchmark. Almost none finds that holy grail, and those that appear to are most likely just lucky. That's because the deck is stacked against allocators: managers generally fail to deliver consistent outperformance in any timeframe that matters.
The main indicator that allocators can use to make good decisions – recent performance – is effectively a random indicator of future performance over a five-year time horizon. Further, when there are significant regime changes, persistence becomes even worse than random chance. Given the lack of evidence that managers can consistently deliver superior performance, allocators would be better served by building a diversified, low-fee portfolio than they would be by building a subjectively concentrated book.
Below we take a look at the performance of individual hedge fund managers from 2008 to 2022. The data in the figure below show the percent of managers that sequentially deliver above-median performance over a 5-year period in blue. If manager performance were driven by random chance, then we would expect to see the proportion of winning managers follow the trajectory illustrated in the figure by the gold bars. The data show little evidence that winning managers can keep winning beyond what one would expect from random chance.
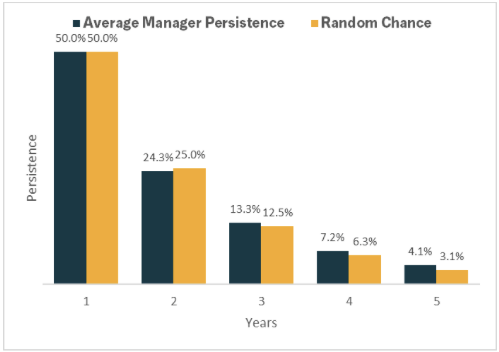
**Source: Preqin
The results depicted are aggregated results and do not represent returns that an investor attained. Past performance not indicative of future results.
Each allocation bet often comes with what sounds like a compelling thesis: “small firms are more agile” or “the biggest funds have the best talent” or “this particular manager has a great track record.” Typically, allocators are spinning narratives that simply rationalize the recent outperformance of certain managers or strategies.
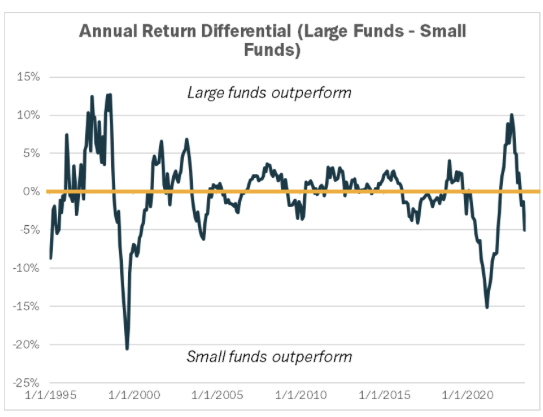
We previously considered two other potential sources of return persistence among managers: size and style. One of the most common tropes in manager selection is the manager size factor. At any moment in time, allocators will confidently assert that one of these two cohorts is better positioned than the other. In reality, the data show that the factor is mean-reverting and past outperformance doesn’t necessarily guarantee persistently higher returns in the future.Reversals of fate also occur with fund styles. Many of the fund styles that were in vogue following strong performance in 2022, had not gotten attention in many years. Global Macro, CTA, and commodity funds all received record attention as they effectively navigated a period of monetary tightening. But allocators who rushed to invest in these funds were in for a nasty surprise this year. Many of the top-performing fund styles from 2022 have been some of the worst-performing funds so far in 2023. Whether it’s the relative performance of individual managers, or of funds of different sizes, or of funds pursuing different styles, we struggle to find evidence supporting the idea that this performance persists.
The results depicted are aggregated results and do not represent returns that an investor attained. Past performance not indicative of future results.
Reversals of fate also occur with fund styles. Many of the fund styles that were in vogue following strong performance in 2022, had not gotten attention in many years. Global Macro, CTA, and commodity funds all received record attention as they effectively navigated a period of monetary tightening. But allocators who rushed to invest in these funds were in for a nasty surprise this year. Many of the top-performing fund styles from 2022 have been some of the worst-performing funds so far in 2023. Whether it’s the relative performance of individual managers, or of funds of different sizes, or of funds pursuing different styles, we struggle to find evidence supporting the idea that this performance persists.
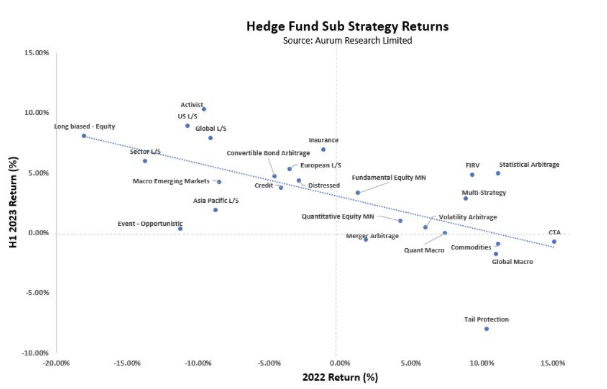
**Source: Aurum Research Limited
The results depicted are aggregated results and do not represent returns that an investor attained. Past performance not indicative of future results.
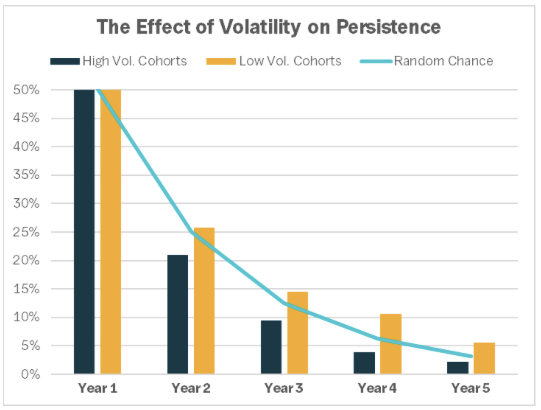
And the odds for performance persistence get even worse when we account for external factors like changes in volatility. If managers do get ‘lucky’ enough to pick funds that outperform over the course of a couple years, it's most likely there was a consistent macro environment that aligned with those manager’s strategies doing well. But when the regime changes and volatility rises, the managers that had been doing well typically underperform even relative to random chance.
Below we group funds’ performance paths into high and low-volatility groups. Over five years, we can see that the two groups roughly split the difference in persistence relative to random chance. High volatility cohorts begin in the years 2008, 2009, 2010, 2016, 2017, and 2018. Low volatility cohorts begin in the years 2011, 2012, 2013, 2014, and 2015. By years four and five, the persistence of low volatility cohorts is nearly double that of the high volatility cohorts.
As long as volatility remains low, managers have a better than random chance of delivering consistent outperformance, but change the environment and the odds reverse.
**Source: Preqin
The results depicted are aggregated results and do not represent returns that an investor attained. Past performance not indicative of future results.
Picking which funds are likely to perform well is hard for allocators, but doing it in a volatile environment where the current regime looks very different from recent history is like going to the casino with the cards stacked against you. The performance information seen during a period of nearly 15 years of monetary stimulation is probably not too helpful in figuring out which managers will perform well during this new era of higher rates and tighter money. If anything the trailing information of this regime shift may even drive worse than random outcomes.
And while here we focus on the persistence of performance, it is important to also understand the incredible range of outcomes that can occur when picking individual managers. As an example, the figure below segments nearly 2000 managers by their three-year annualized returns. The range is huge, with the standard deviation of individual managers’ annualized returns approaching 15%. Given that performance is not persistent, it’s entirely possible to see managers switch from the right half of the distribution to the left half and vice versa. This can produce enormous return swings and makes allocation even more challenging.
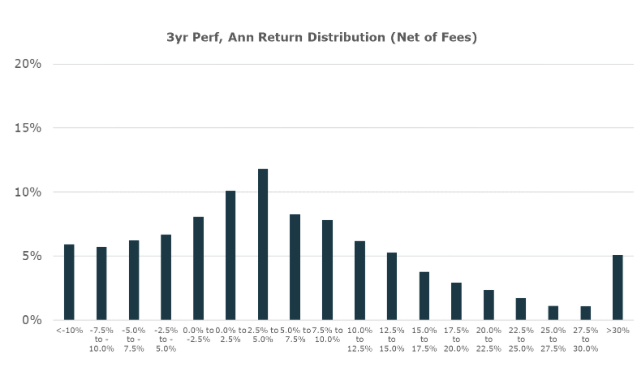
**Source: Preqin
The results depicted are aggregated results and do not represent returns that an investor attained. Past performance not indicative of future results.
Given the uncertainty that accompanies performance impersistence, allocators would likely be better served by building a diversified portfolio of alpha which is likely to generate returns that are more consistent than by trying to pick which managers and funds will outperform.
Of course there is always the other option… just leave it to the dart throwing monkeys.
For informational and educational purposes only and should not be construed as investment advice. The historical analysis discussed herein has been selected solely to provide information on the development of the research and investment process and style of Unlimited. It does not constitute an offer to sell or a solicitation of an offer to buy any security. Opinions expressed are our present opinions only. The material is based upon information which we consider reliable, but we do not represent that such information is accurate or complete, and it should not be relied upon as such. The historical analysis should not be construed as an indicator of the future performance of any investment vehicle that Unlimited manages. No investment strategy or risk management technique can guarantee return or eliminate risk in any market environment. No Representation is being made that any investment will or is likely to achieve profits or losses similar to those shown herein.
