
Don’t Overweight Cash Unless You’re a Market-Timing Genius
Subscribe to Our Blog
Effectively timing the market requires extreme skill. Fortunately, diversification allows investors to reap comparable performance benefits.
In 2022, cash had a banner year and beat almost every asset class. The data show that as most asset classes and alternative strategies experienced drawdowns, cash delivered positive nominal returns. In fact, only energy equities and oil outpaced cash in 2022. And even as other asset classes have recovered in 2023, investors find themselves in an environment where it doesn’t feel like there is a big yield penalty to sitting on cash. So on some level, it makes sense to be torn between cash and assets. But the data tell a different story: improving returns through market-timing requires an extreme level of market-timing ability.
Cash broadly outperforming assets happens very infrequently. The figure below shows the trailing 12-month return differential between cash and assets. Here assets are represented by a basket of stocks (30%), bonds (55%), and broad commodities (15%). Over the total period, assets beat cash in 65% of months.
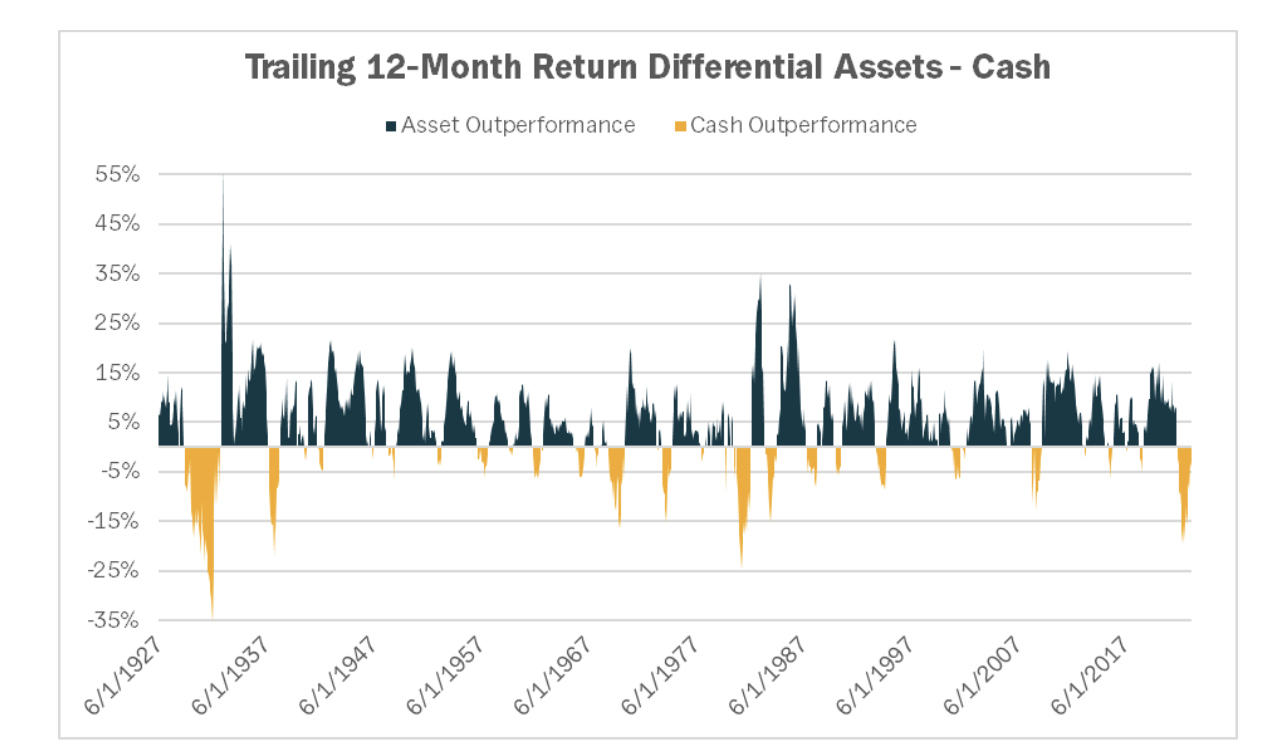
**Source: FRED, Fama French, Yahoo Finance, Unlimited Analysis
The results depicted are aggregated results and do not represent returns that an investor attained.
Past performance is not indicative of future results.
And not only do assets have a better batting average than cash, they have a higher slugging percentage as well. With these odds in mind – that assets have historically outperformed cash with greater frequency and magnitude – we wanted to see just how skilled at market-timing an investor would need to be to beat a simple allocation to just assets.
We use 94 years of monthly historical data to calculate the average and standard deviation of returns for cash and assets. We then use these historical distributions to create hypothetical return paths for cash and assets. In both cases, we generate 100 scenarios spanning 500 months. The simulated return paths for assets are shown in the figure below. For the sake of simplicity, we limited our scenarios to 100, but greater precision could be obtained with more scenarios.
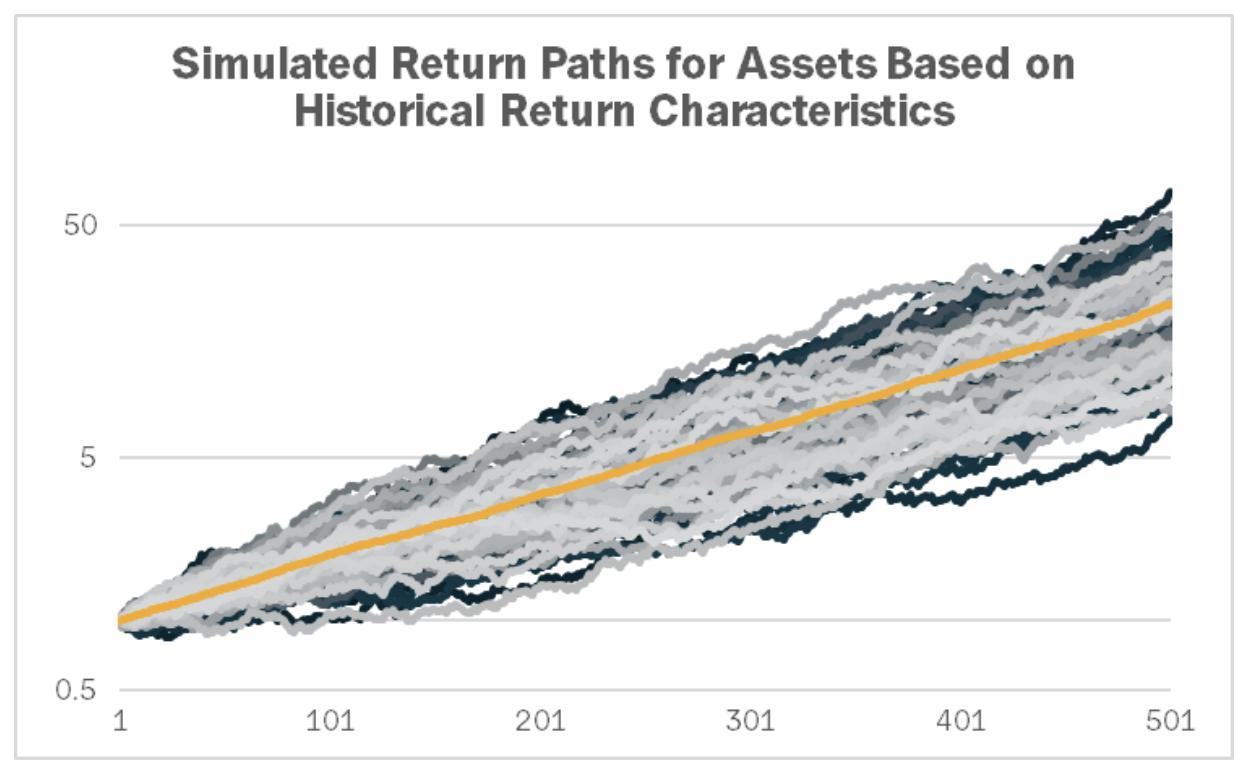
**Source: FRED, Fama French, Yahoo Finance, Unlimited Analysis
The results depicted are aggregated results and do not represent returns that an investor attained.
Past performance is not indicative of future results.
We use this same approach to model a series of paths that represent varying degrees of skill in choosing between cash and assets. First, we show a path that randomly chooses between cash and assets each month. Over enough iterations, this return path simulates an investor that correctly moves from cash to assets 50% of the time, in other words, an investor that has no timing skill. The data show that the returns of no-skill market timing are considerably lower than what could be achieved through a full allocation to just assets.
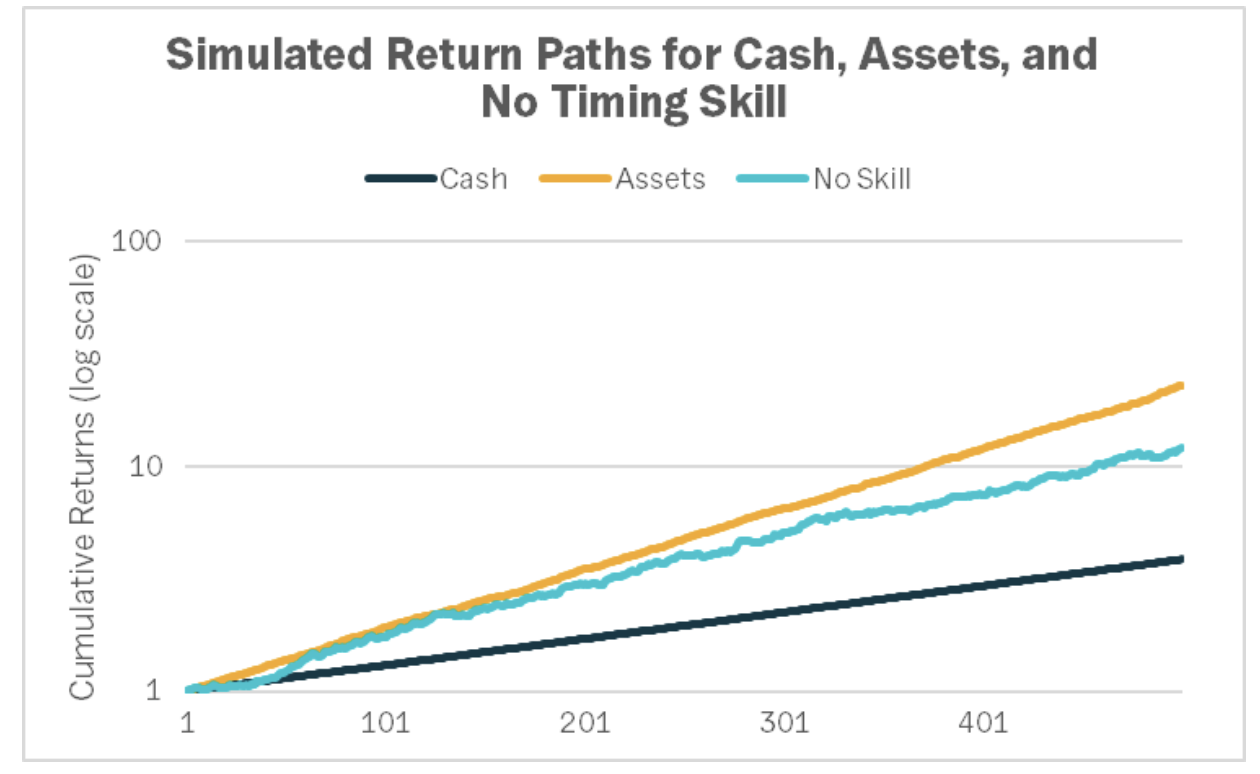
**Source: FRED, Fama French, Yahoo Finance, Unlimited Analysis
The results depicted are aggregated results and do not represent returns that an investor attained.
Past performance is not indicative of future results.
So, how skilled at market-timing do you have to be to beat an allocation to pure assets? A return path that correctly picks monthly asset outperformance with 67.5% accuracy achieves roughly the same gross returns as a pure asset allocation over the course of 500 months. Intuitively this makes sense as it is roughly the proportion of months that assets beat cash.
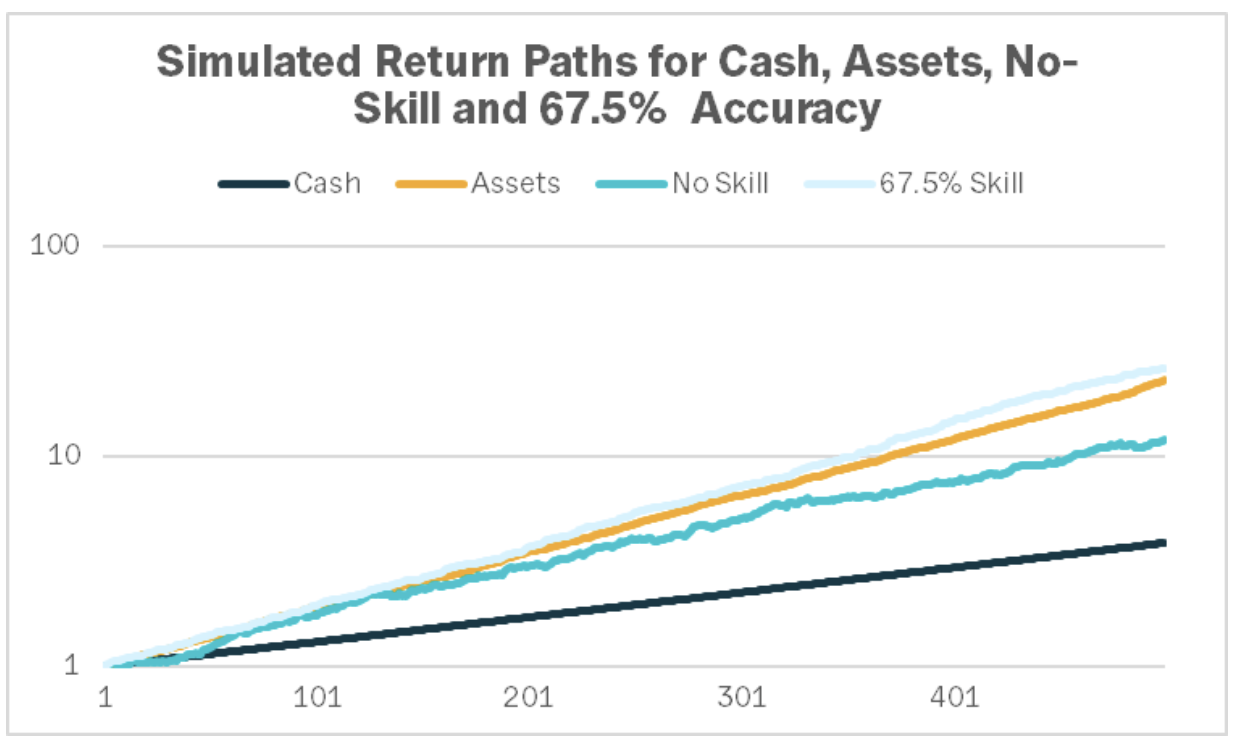
**Source: FRED, Fama French, Yahoo Finance, Unlimited Analysis
The results depicted are aggregated results and do not represent returns that an investor attained.
Past performance is not indicative of future results.
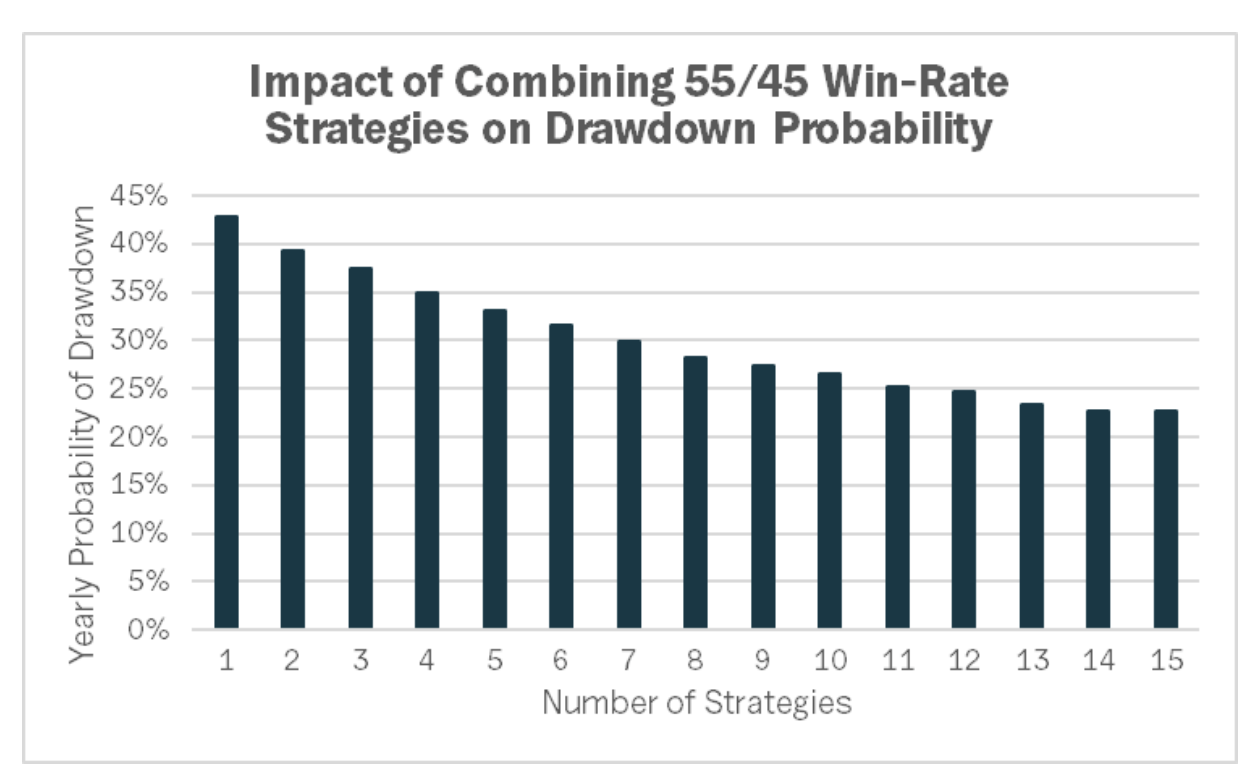
For most investors, delivering consistent outperformance is both daunting and highly improbable. 67.5% accuracy is a high standard; many of the best investors hope to be right 55% of the time. To put this benchmark in context, a strategy that is ‘right’ 55% of the time has a Sharpe ratio of about 0.2. Alone, this isn’t that impressive. But if you can find an uncorrelated basket of these strategies, your overall accuracy, or win-rate, increases substantially. The figure below shows how sequentially combining up to 15 uncorrelated 55/45 win-rate strategies decreases the probability of losing money in a given year from ~45% to ~20%. This is how winning just 55% of the time as an investor can put you in world-class territory and why some consider a basket of 55/45 win-rate strategies the ‘holy grail’ of investing.
**Source: FRED, Fama French, Yahoo Finance, Unlimited Analysis
The results depicted are aggregated results and do not represent returns that an investor attained.
Past performance is not indicative of future results.
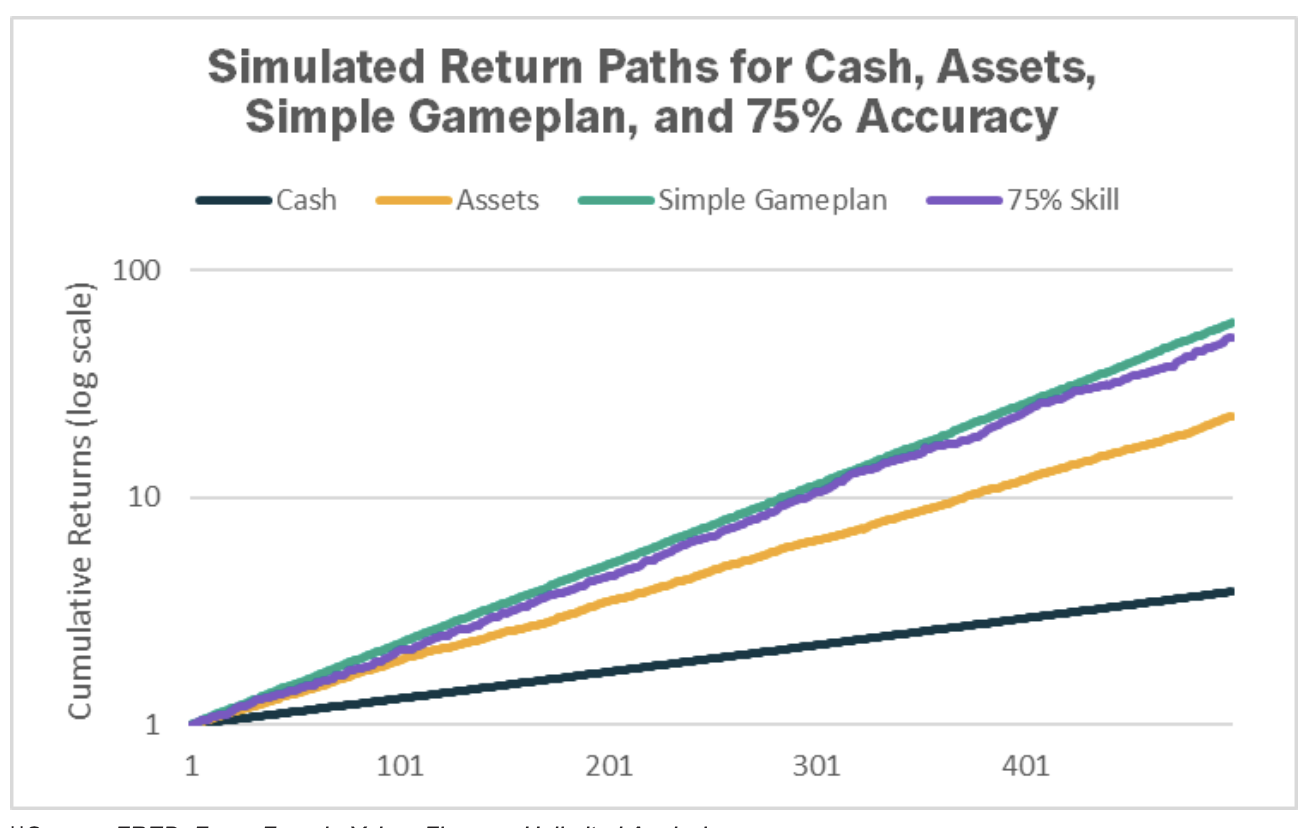
Previously, we introduced a simple investment gameplan. The simple gameplan recognizes that different macroeconomic environments favor different asset classes. The simple game plan seeks to embrace uncertainty around stagflation, monetary tightening, and geopolitical conflict through diversification. If you haven’t already, it's worth reading the full writeup on the investment framework, but at a high-level, the simple game plan is diversified across cash, assets, and alpha strategies.
We used the same simulation-based approach to model the returns typical of the ‘simple investment gameplan’. By using this framework, we found we can achieve a return path that is comparable to one with 75% market-timing ability, or 50% better than random guessing.
**Source: FRED, Fama French, Yahoo Finance, Unlimited Analysis
The results depicted are aggregated results and do not represent returns that an investor attained.
Past performance is not indicative of future results.
This exercise underscores one of our core beliefs at Unlimited: diversification is the primary strength of any portfolio. Timing is hard. Even good timing between cash and assets puts you even with asset-like returns and would take a considerable amount of work to achieve. However, diversifying with an approach like the one outlined in our ‘simple game plan’ can eliminate a lot of hard-work and deliver performance benefits comparable to high-skill market timing. Accurately calling market peaks and troughs is just as challenging as it is alluring. Diversification may not be sexy but it gets the job done.
For informational and educational purposes only and should not be construed as investment advice. It does not constitute an offer to sell or a solicitation of an offer to buy any security. Opinions expressed are our present opinions only. No Representation is being made that any investment will or is likely to achieve profits or losses similar to those shown herein. No investment strategy or risk management technique can guarantee return or eliminate risk in any market environment. The material is based upon information which we consider reliable, but we do not represent that such information is accurate or complete, and it should not be relied upon as such. The historical analysis should not be construed as an indicator of the future performance of any investment vehicle that Unlimited manages.
